This example is adapted from the Readme of the package jupyter-mode, ref.
The goal is to show how to write a literate program that integrates a function and displays it, as well as how to package it so that its' library functions can be used by other python programs.
Using a properties-drawer we can accumulate individual source-blocks from all subheaders:
* testing emacs-jupyter special output
  :PROPERTIES:
  :header-args: :noweb-ref picture_output.lib
  :END:
Noweb-refs are then used to insert src-blocks:
"""Use numpy and scipy to produce a picture"""
from ob_example.utils.libutils import export
# from ob_example.utils.libutils import export
from scipy.integrate import quad
import numpy as np
import matplotlib.pyplot as plt
We put all the library functions after the imports:
@export
def fun(x_num):
    return (x_num-3)*(x_num-5)*(x_num-7)+85
Tests:
from ob_example.plotter.picture_output import *
def test_fun():
    """Testing the base case for the integral"""
    assert fun(3) == 85
And finally the main code. We add pass in the pattern in case we don't create any main-code
def main():
    pass
    A, B = 1, 8 # the left and right boundaries
    INTEGRAL, ERROR = quad(fun, A, B)
    import numpy as np
    N = 5 # the number of points
    XINT = np.linspace(A, B, N)
    YINT = fun(XINT)
    print(XINT)
    print(YINT)
    INTEGRAL_TRAPEZOID = sum((XINT[1:] - XINT[:-1]) * (YINT[1:] + YINT[:-1]) / 2)
    print("The integral is:", INTEGRAL, "+/-", ERROR)
    print("The trapezoid approximation with", len(XINT), "points is:",
          INTEGRAL_TRAPEZOID)
    #%matplotlib inline
    XBAR = np.linspace(0, 10, 200)
    YBAR = fun(XBAR)
    plt.plot(XBAR, YBAR, lw=2)
    plt.axis([0, 9, 0, 140])
    plt.fill_between(XINT, 0, YINT, facecolor='gray', alpha=0.4)
    plt.text(0.5 * (A + B), 30,r"$\int_A^B fun(XBAR)dxbar$",
    	 horizontalalignment='center', fontsize=20);
We start by importing the @export "decorator" that we use to define
public functions explicitly.
This block when tangled is placed at the top in our module with all other imports.
#+BEGIN_SRC python :session picoutput :noweb-ref "picture_output.imports"from ob_example.utils.libutils import export
To create a python package we need to create an __init__.py file in
the root of the package directory. Note the :tangle __init__.py
header argument. Relative imports.
#+BEGIN_SRC python :noweb-ref "" :tangle __init__.py# from ob_example.plotter.picture_output import *
#+END_SRC
TODO: consider # exports plotter._init__ note that nbdevdiffnbs fails when using #exports init</span> above
# from ob_example.utils.libutils import export
@export
def fun(x_num):
    return (x_num-3)*(x_num-5)*(x_num-7)+85
A basic integral.
def test_fun():
    """Testing the base case for the integral"""
    assert fun(3) == 85
Always include a test
and when you find a bug and fixes it, make sure to add another test that ensures the fix works. Sometimes a fix breaks the function for other input that worked previously, so tests should accumulate.
We’re going to approximate the integral via the trapezoid rule and also calculate it to a finer degree.
A, B = 1, 8 # the left and right boundaries
I found the quad function from scipy for a precise integral calculation. For the trapezoid calculation, I found this explanation similar to what many of us learn in our later school-years, but not sure how to do that in python. Let's experiment!
from scipy.integrate import quad
INTEGRAL, ERROR = quad(fun, A, B)
import numpy as np
N = 5 # the number of points
XINT = np.linspace(A, B, N)
YINT = fun(XINT)
print(XINT)
print(YINT)
INTEGRAL_TRAPEZOID = sum((XINT[1:] - XINT[:-1]) * (YINT[1:] + YINT[:-1]) / 2)
To do a standard area calculation for a trapezoid we certainly need a number of x and y values.
import numpy as np
#+BEGIN_SRC python :session picoutput :noweb-ref "trapz_vars" :exports bothN = 5 # the number of points
XINT = np.linspace(A, B, N)
YINT = fun(XINT)
print(XINT)
print(YINT)
We can sum and differentiate the Y and X arrays, before taking the product in a zip-like manner:
print(YINT[1:]+YINT[:-1])
print(XINT[1:]-XINT[:-1])
Yes, that looks plausible. Is 1.75 really the x delta we defined earlier though?
Lets check with the values we entered before. 8-1 is the x range, and 5 values would create 4 trapezoids, so:
print((8-1)/4)
So it must be right.
Lets try and multiply two arrays as well:
(XINT[1:] - XINT[:-1]) * (YINT[1:] + YINT[:-1])
Looks correct also.
Then for the full calculation we just sum that and divide by 2 as explained why in more detail in the reference above:
#+BEGIN_SRC python :session picoutput :noweb-ref "trapz_calc" :exports bothsum((XINT[1:] - XINT[:-1]) * (YINT[1:] + YINT[:-1]) / 2)
Now, lets see the difference between estimate and the precision-calculation!
#+BEGIN_SRC python :noweb-ref "picture_output.main" :session picoutput :exports bothprint("The integral is:", INTEGRAL, "+/-", ERROR)
print("The trapezoid approximation with", len(XINT), "points is:",
INTEGRAL_TRAPEZOID)
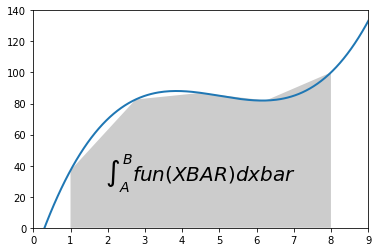
This code block will produce a plot of the function and our trapezoid
approximation to the integral. We tell Org Babel to save the plot to
a file (which Emacs can display inline) by typing M-x
org-toggle-inline-images RET.
import matplotlib.pyplot as plt
XBAR = np.linspace(0, 10, 200)
YBAR = fun(XBAR)
plt.plot(XBAR, YBAR, lw=2)
plt.axis([0, 9, 0, 140])
plt.fill_between(XINT, 0, YINT, facecolor='gray', alpha=0.4)
plt.text(0.5 * (A + B), 30,r"$\int_A^B fun(XBAR)dxbar$",
	 horizontalalignment='center', fontsize=20);
Tests can be executed directly from org-babel because it has support
for most languages including shell/bash. So from this same
source-file, we can enter C-c C-c on below src-block:
#PYTHONPATH="${path}:$PYTHONPATH" python3 -m unittest -v \
# nbs.picture_output_test 2>&1
shopt -s globstar; cd "${path}/ob_example"; pytest . 2>/dev/null; cd -

cd "$path" ; PYTHONPATH="${path}:$PYTHONPATH" nbdev_test_nbs ; cd -
A functional test would be
cd "$path" ; PYTHONPATH="${path}:$PYTHONPATH" \
               python3 -c \
               'from ob_example import * ;\
               print(fun(3)) ;\
               plotter.picture_output.main() ;'
echo ; echo $?

cd "$path" ; PYTHONPATH="${path}:$PYTHONPATH" \
      python3 -c \
      'from ob_example.plotter.picture_output import fun, main ;\
      print(fun(3)) ;\
      main() ;'
echo ; echo $?When importing the export function from this module, we can use
@export as decorator for functions we want included in __all__.